MetaMesh
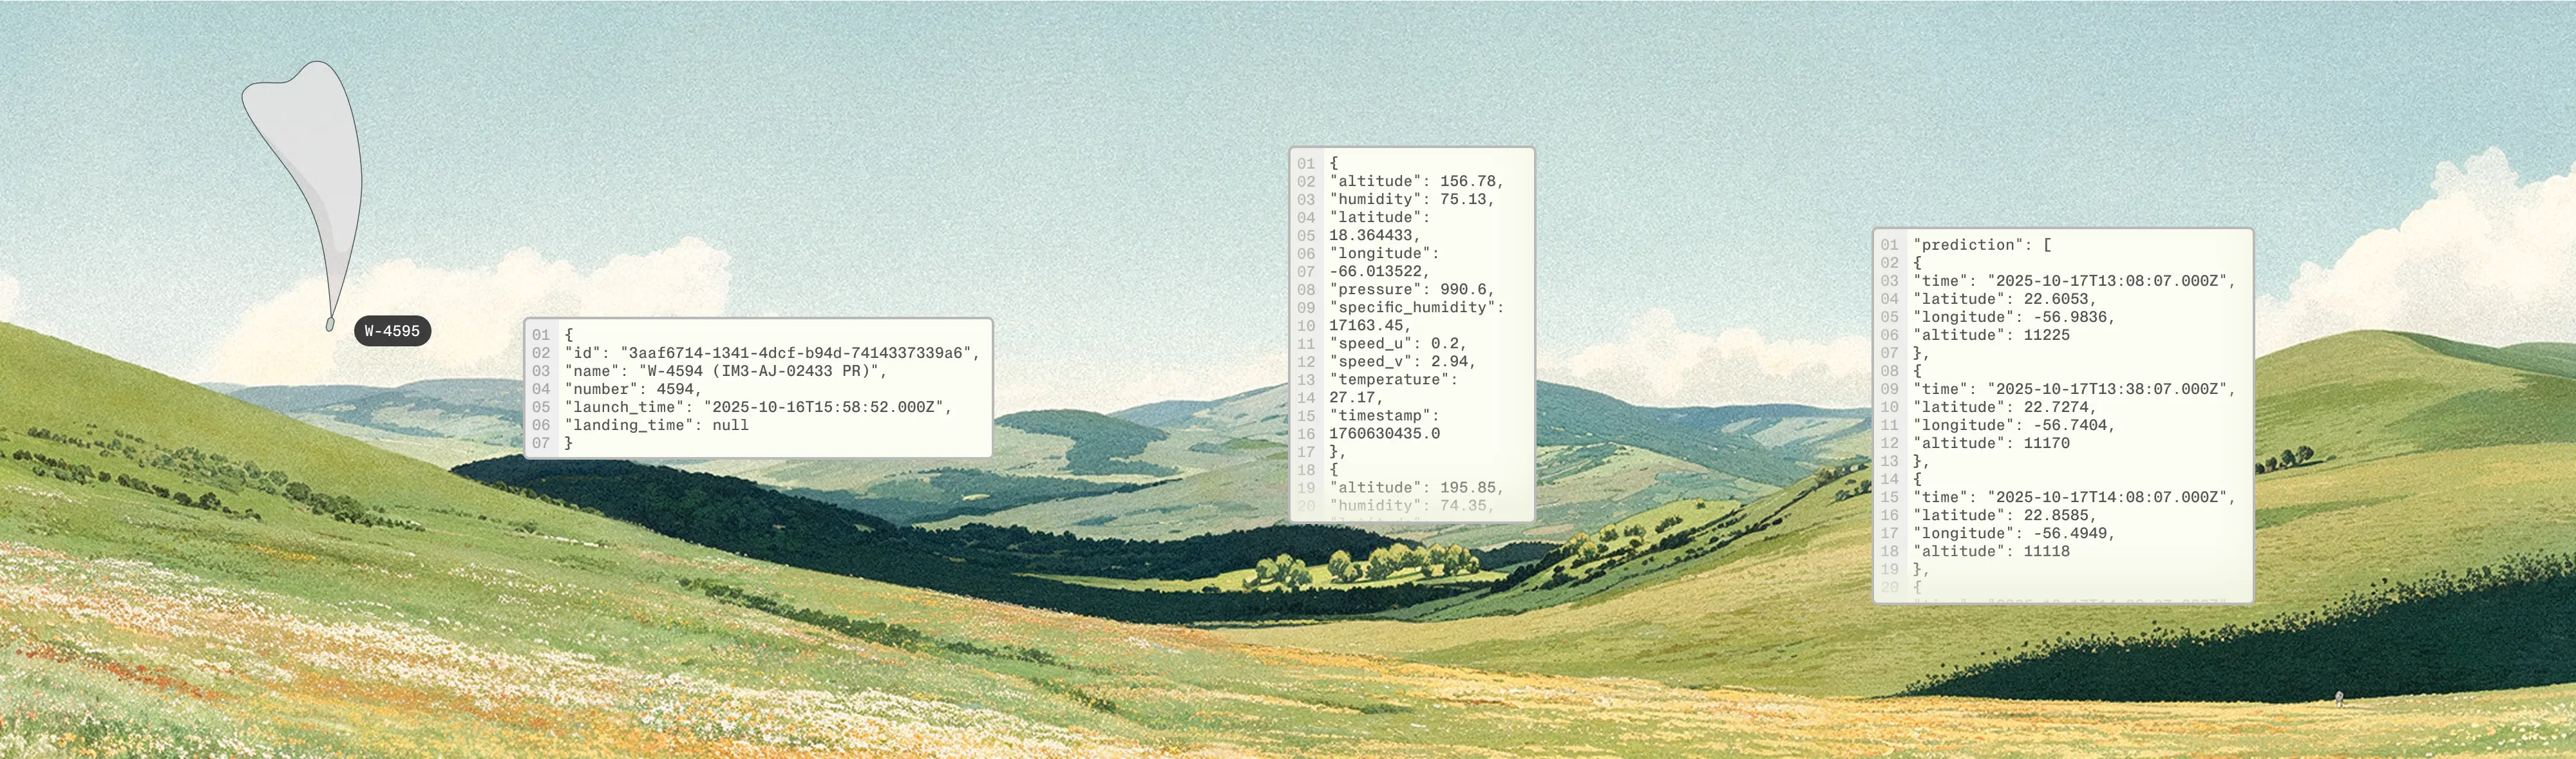
MetaMesh is WindBorne's multi-model blended forecast product. Rather than relying on any single weather model, MetaMesh combines forecasts from multiple leading models to produce a single, more accurate prediction.
1. Model Metadata
| Name | MetaMesh |
| Model Code | mm |
2. Forecasting Regime
| Initialization Frequency | MetaMesh is available at 00z, 06z, 12z, and 18z. As input models for a given initialization time become available, MetaMesh incorporates them on a rolling basis, improving progressively until all inputs have been ingested. |
| Forecast Horizon | 15 days |
| Forecast Time Steps | Hourly |
3. Input Models
MetaMesh blends forecasts from multiple sources, using each cycle's latest available data to produce a single bias-corrected output.
| NOAA | HRRR, GFS, GFS Ensemble |
| ECMWF | IFS, IFS Ensemble, AIFS, AIFS Ensemble |
| WindBorne | WeatherMesh-4.5, WeatherMesh Pointy |
4. Model Resolution
MetaMesh is available in two modes. Both use the same multi-model blending approach to learn and correct local model biases, but differ in how those biases are learned.
Both modes are served from the same Point Forecast endpoint and can be queried by either station ID or by lat/lon coordinates. When a coordinate query falls within a certain radius of a supported station, MetaMesh will snap the request to that station and return the Station Forecast in preference to the dynamic Point Forecast.
Static Station Forecast
Trained on METAR observation data at fixed station locations. MetaMesh learns station-specific biases to deliver higher accuracy.
Station forecasts are pre-computed and saved for initialization cycles (00z, 06z, 12z, 18z), so historical init times can be retrieved.
| Coverage | 349 METAR stations (majority in United States; includes Canada, Mexico, and Europe) |
| Training Data | METAR observations |
See Available Stations for the full list of supported stations.
Point Forecast
Trained on ERA5 reanalysis data, allowing forecasts at any location worldwide. The regression learns global, gridded model biases from ERA5 rather than station observations, making it location-independent.
Point forecasts are computed on-demand, only the latest initialization cycle is served. Historical init times are not stored.
| Coverage | Any lat/lon pair globally |
| Training Data | ERA5 reanalysis |
5. Outputs & Products
| Forecast Time Steps | Hourly |
| Surface Variables | 9 |
| temperature_2m | ✓ |
| dewpoint_2m | ✓ |
| pressure_msl | ✓ |
| wind_u_10m | ✓ |
| wind_v_10m | ✓ |
| wind_u_100m | ✓ |
| wind_v_100m | ✓ |
| wind_speed_10m | ✓ |
| wind_speed_100m | ✓ |
| Delivery Format | JSON via cURL, PyPi package, or CLI |
See Point Forecast API for usage — query by coordinates or station ID.
6. Benchmarks
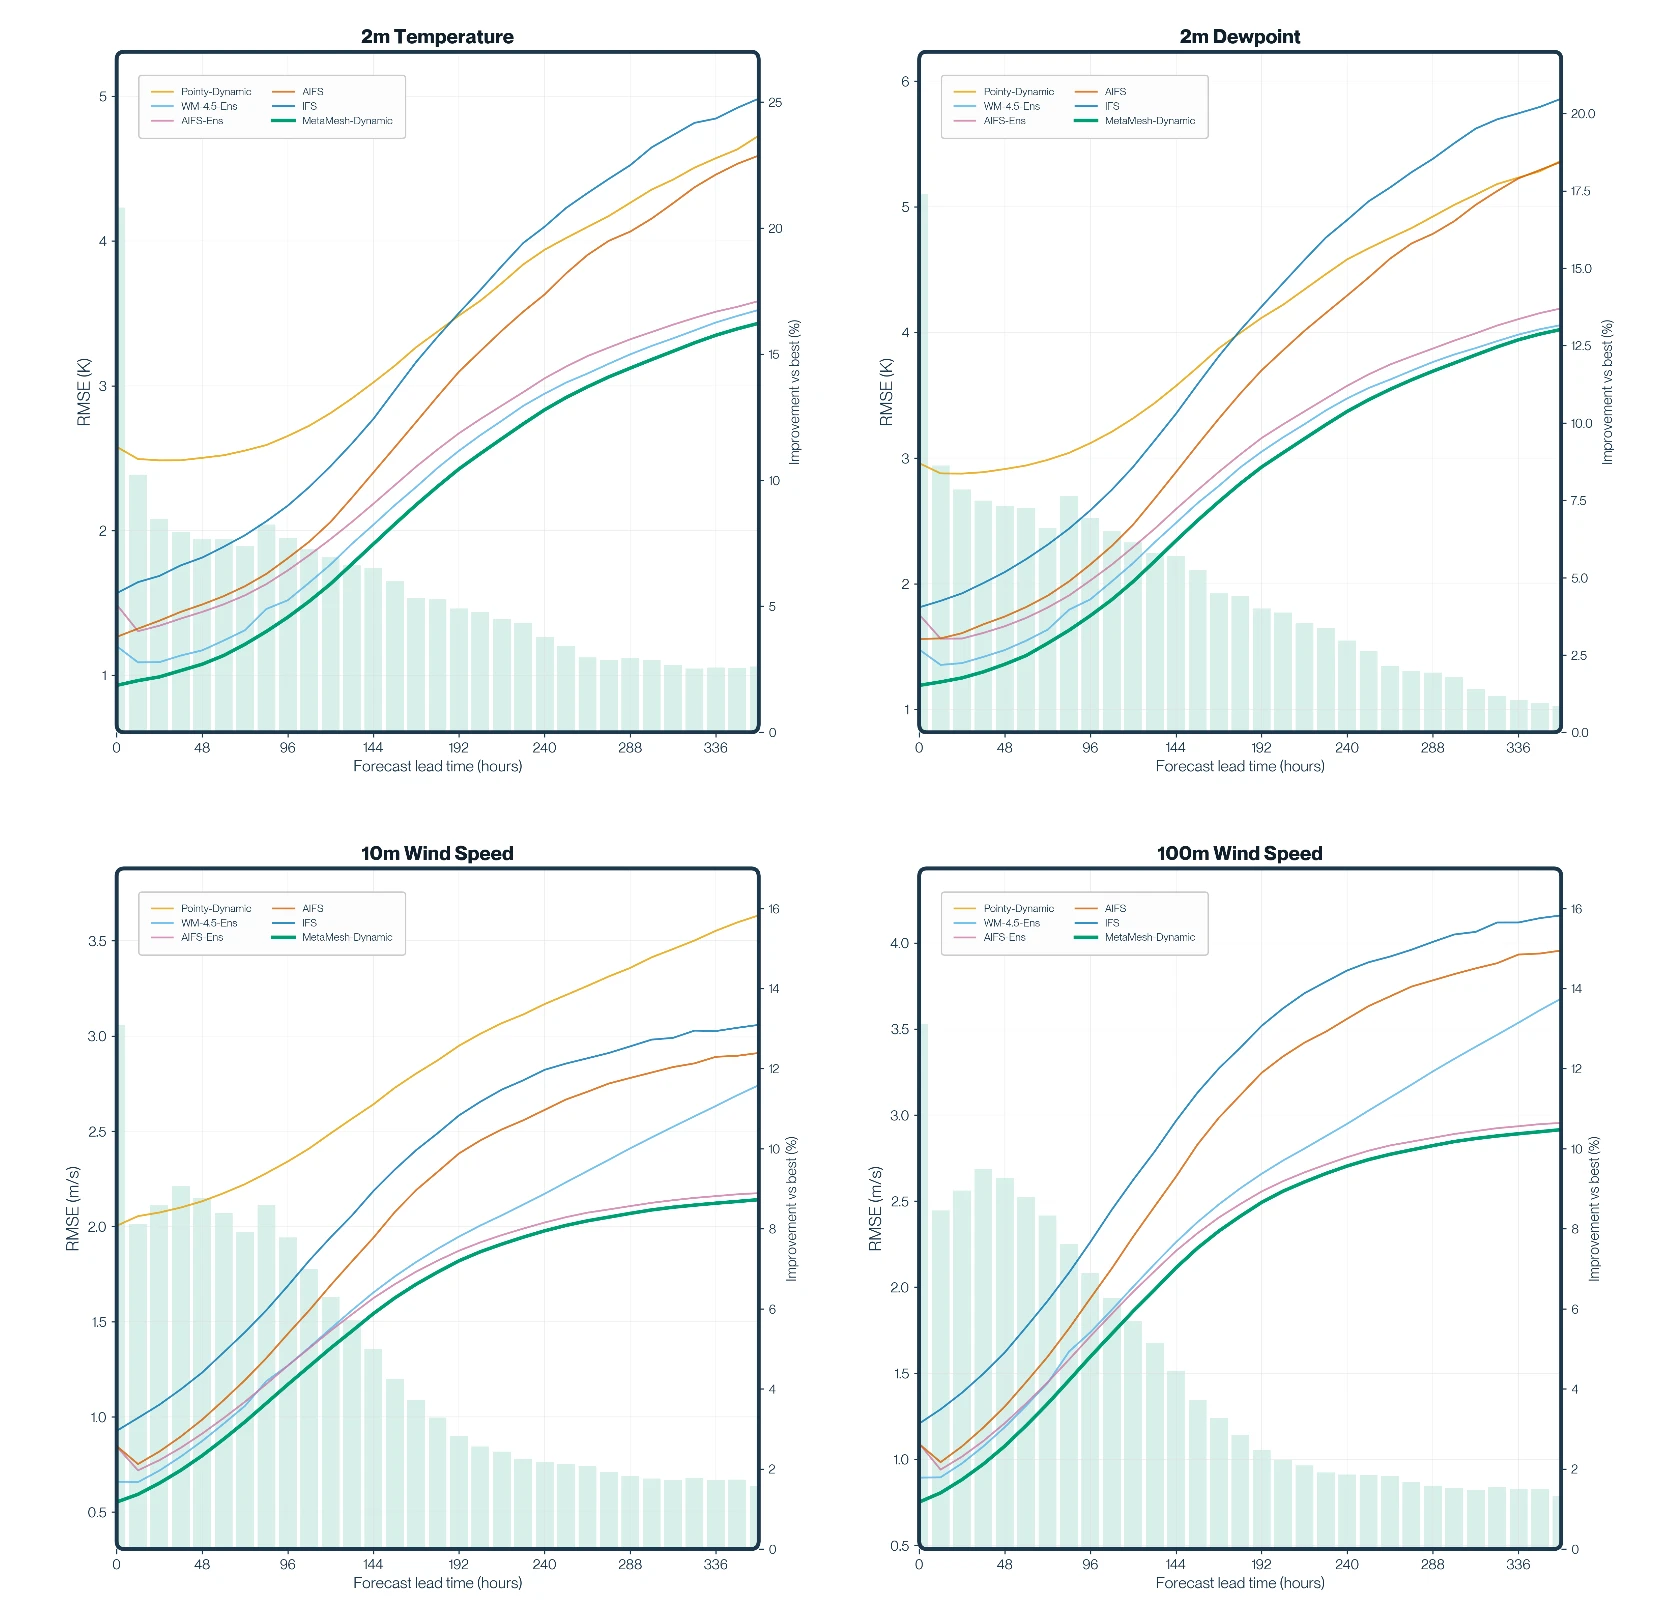
MetaMesh beats every model that goes into it. Below, we evaluate the dynamic blend against ERA5 at 35,350 grid points globally across 4 variables and out to 15 days. MetaMesh outperforms the best individual model on 100% of the points across the entire evaluation period. Blending is especially important at longer horizons. At Day 15, when the spread between individual models doubles, MetaMesh continues to track the best of them.
To understand these results, we asked ourselves if MetaMesh is just a clever blend of public models, or is our constellation actually moving the needle? To find out, we re-ran the whole evaluation with WeatherMesh stripped out. The gap between the two lines is what WindBorne's proprietary data adds.
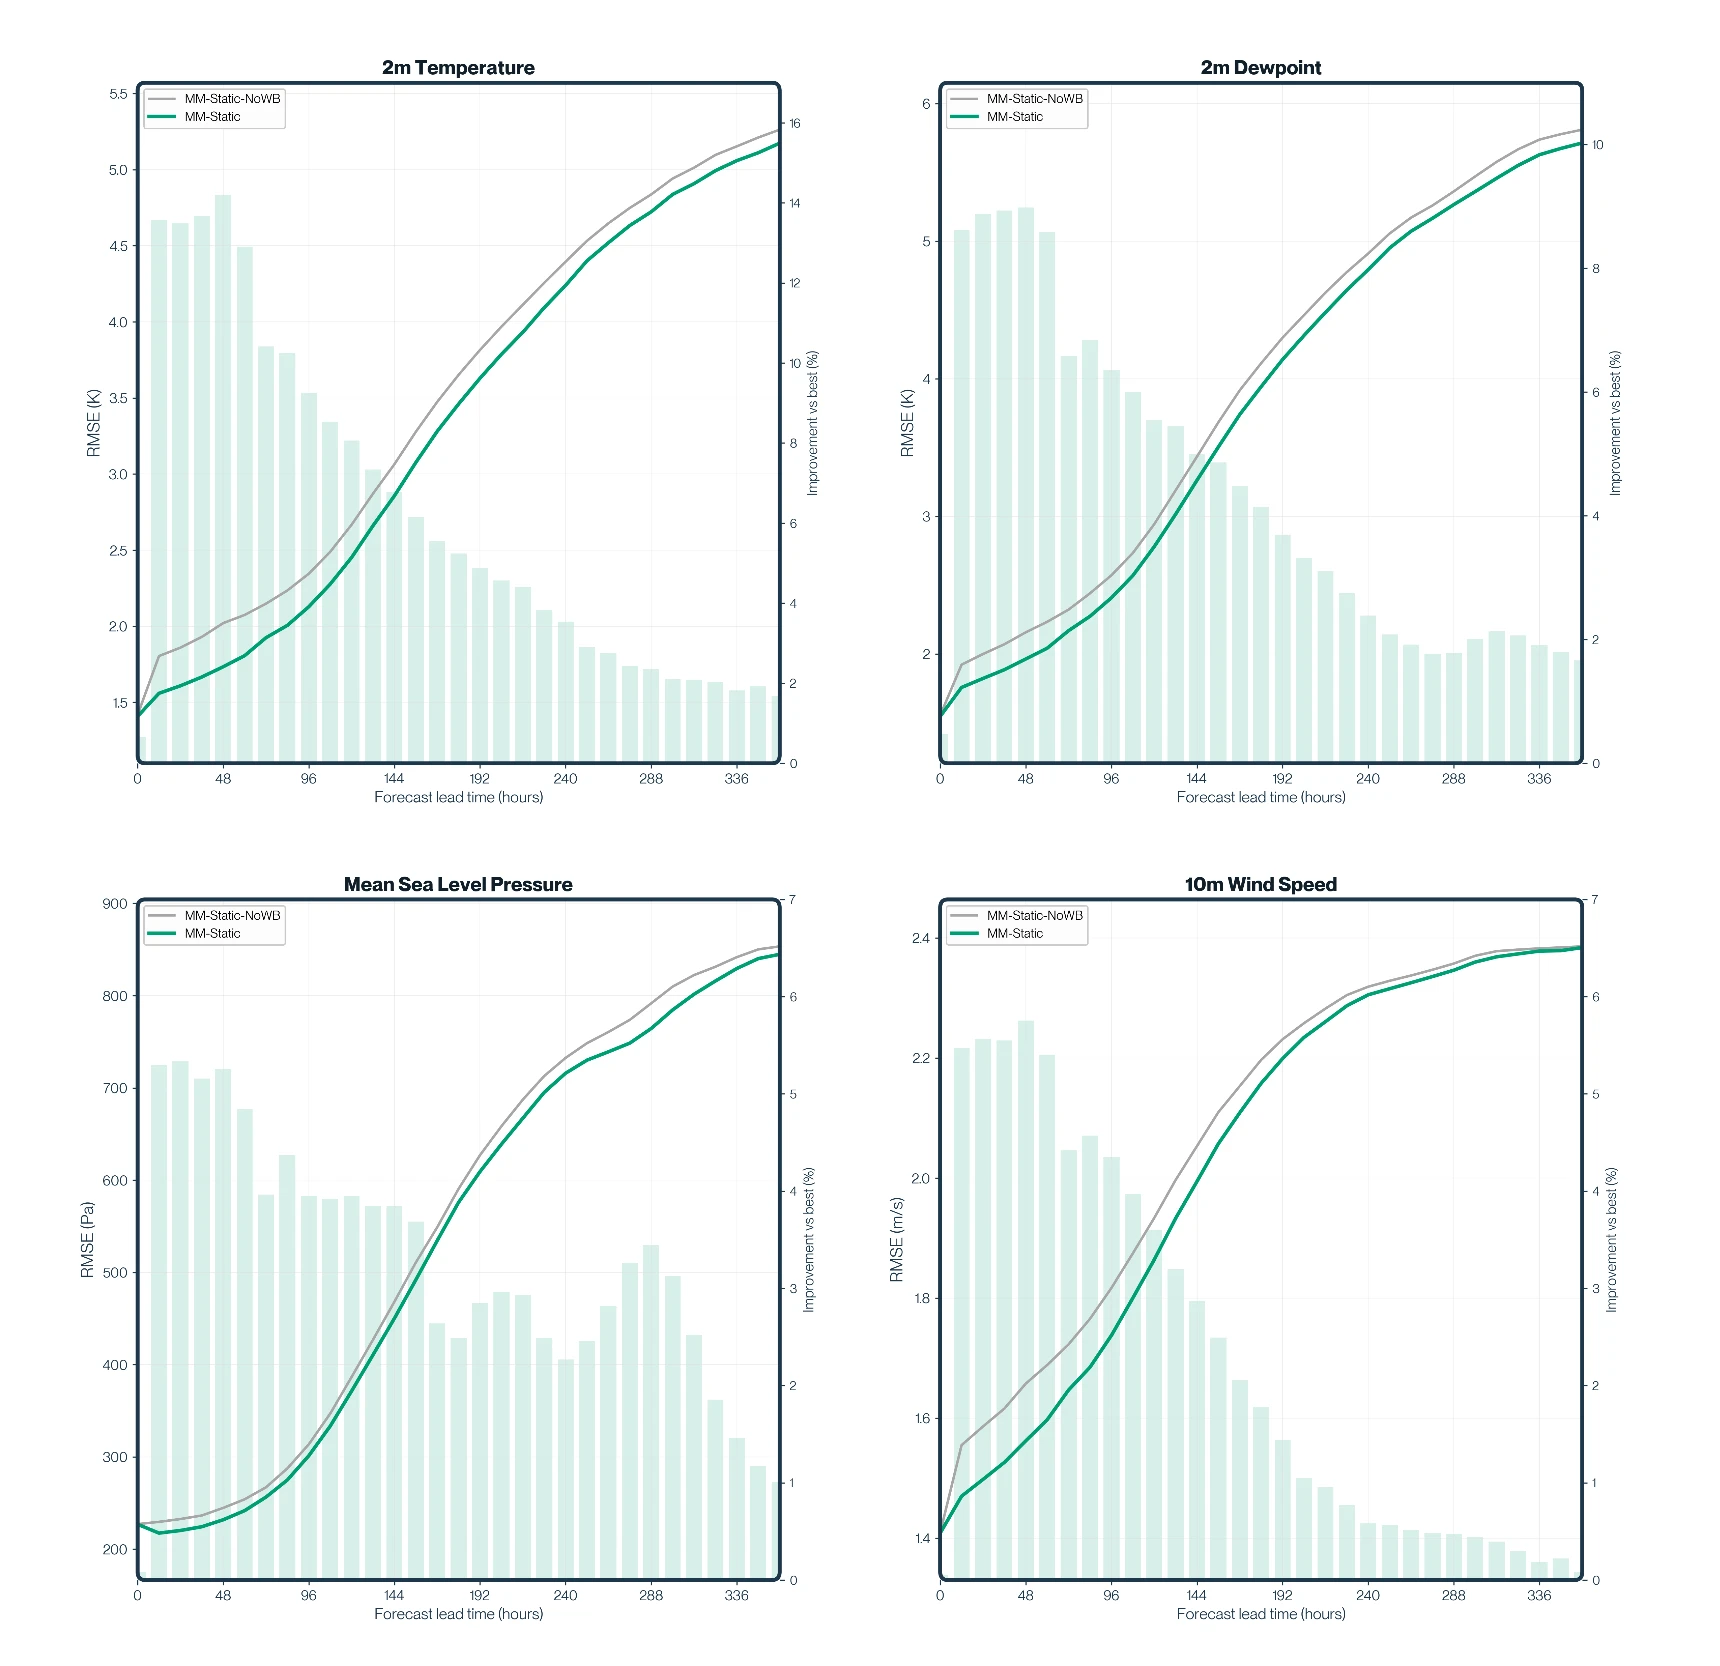
And it'll only grow from here. The results above reflect ~300 balloons aloft today. The constellation is on track to double every 6 months, and every additional balloon is data no other model has.
The other part of the story is the architecture of MetaMesh itself. No single forecast model is best at everything (yet). Each has its strengths, its blind spots, and a window of lead times where it leads. The case for a multi-model blend is to recognize that honestly and combine inputs in a way no single model can replicate. If you color every METAR station by which model wins there, you get a patchwork, and the patchwork shifts as lead time grows.
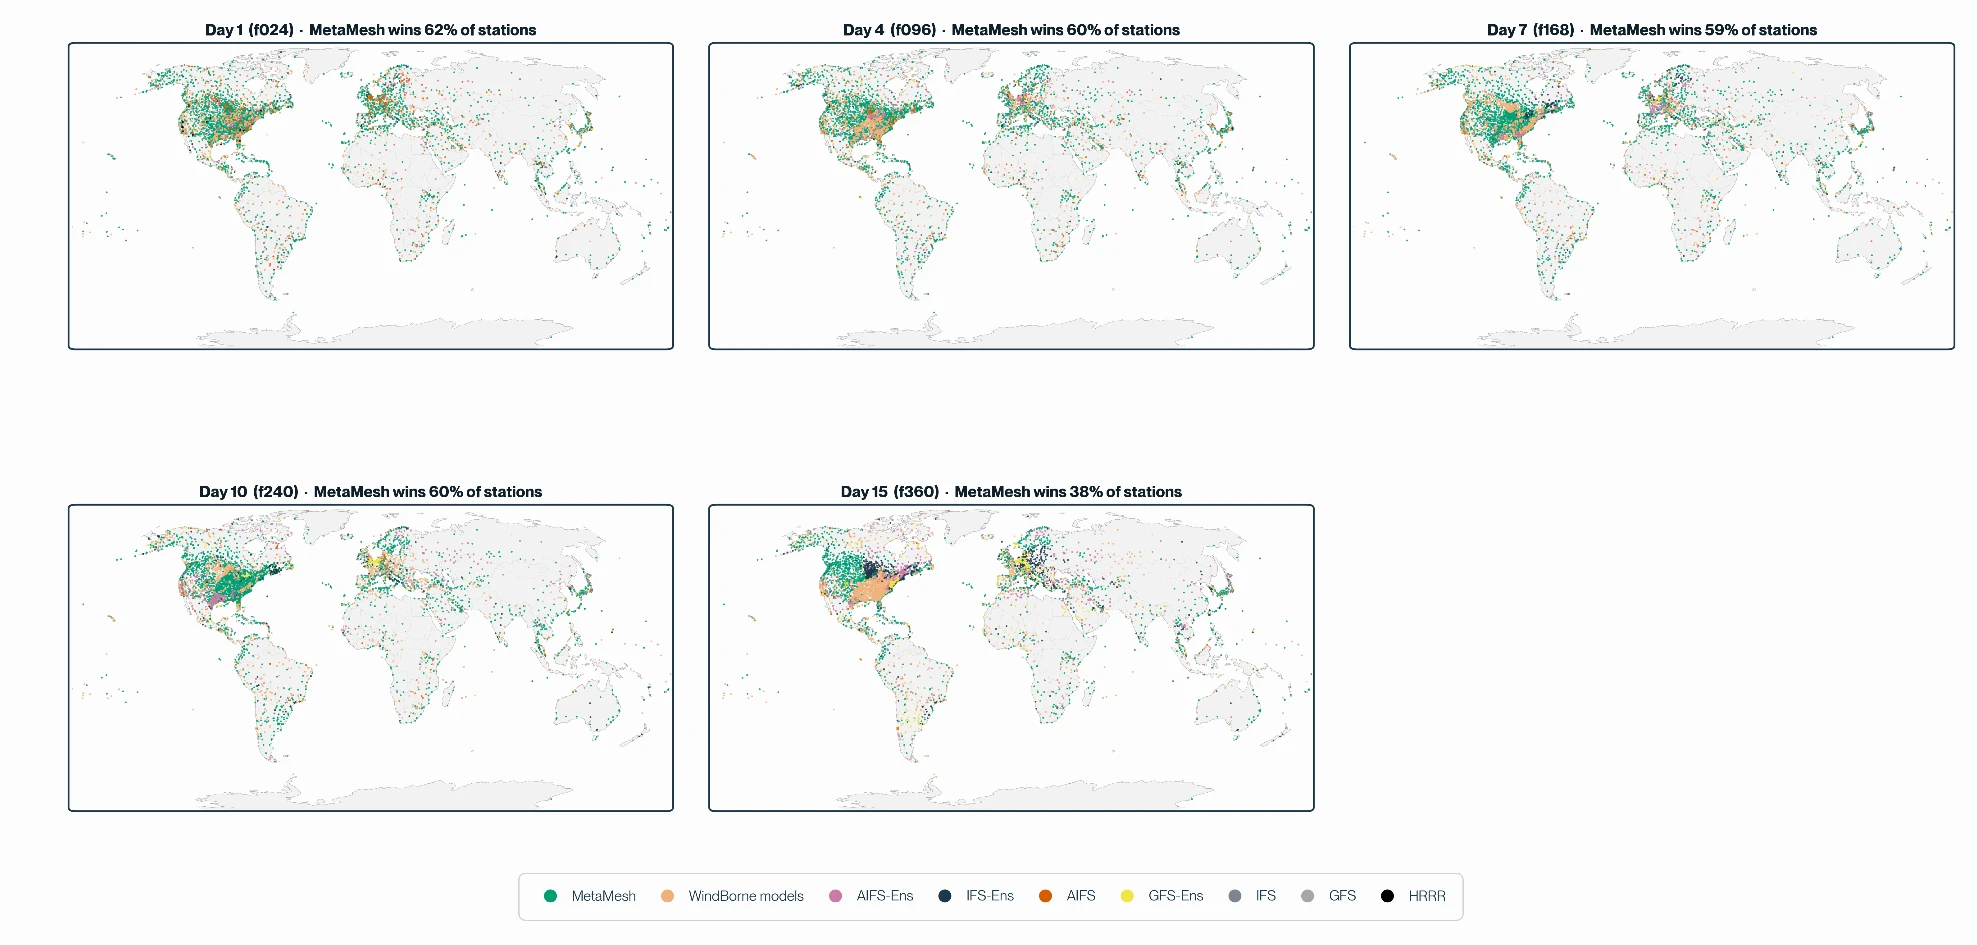
In this complicated patchwork, MetaMesh learns where each input is reliable and weights it accordingly, so the customer gets the best available signal instead of having to pick one model and live with it.
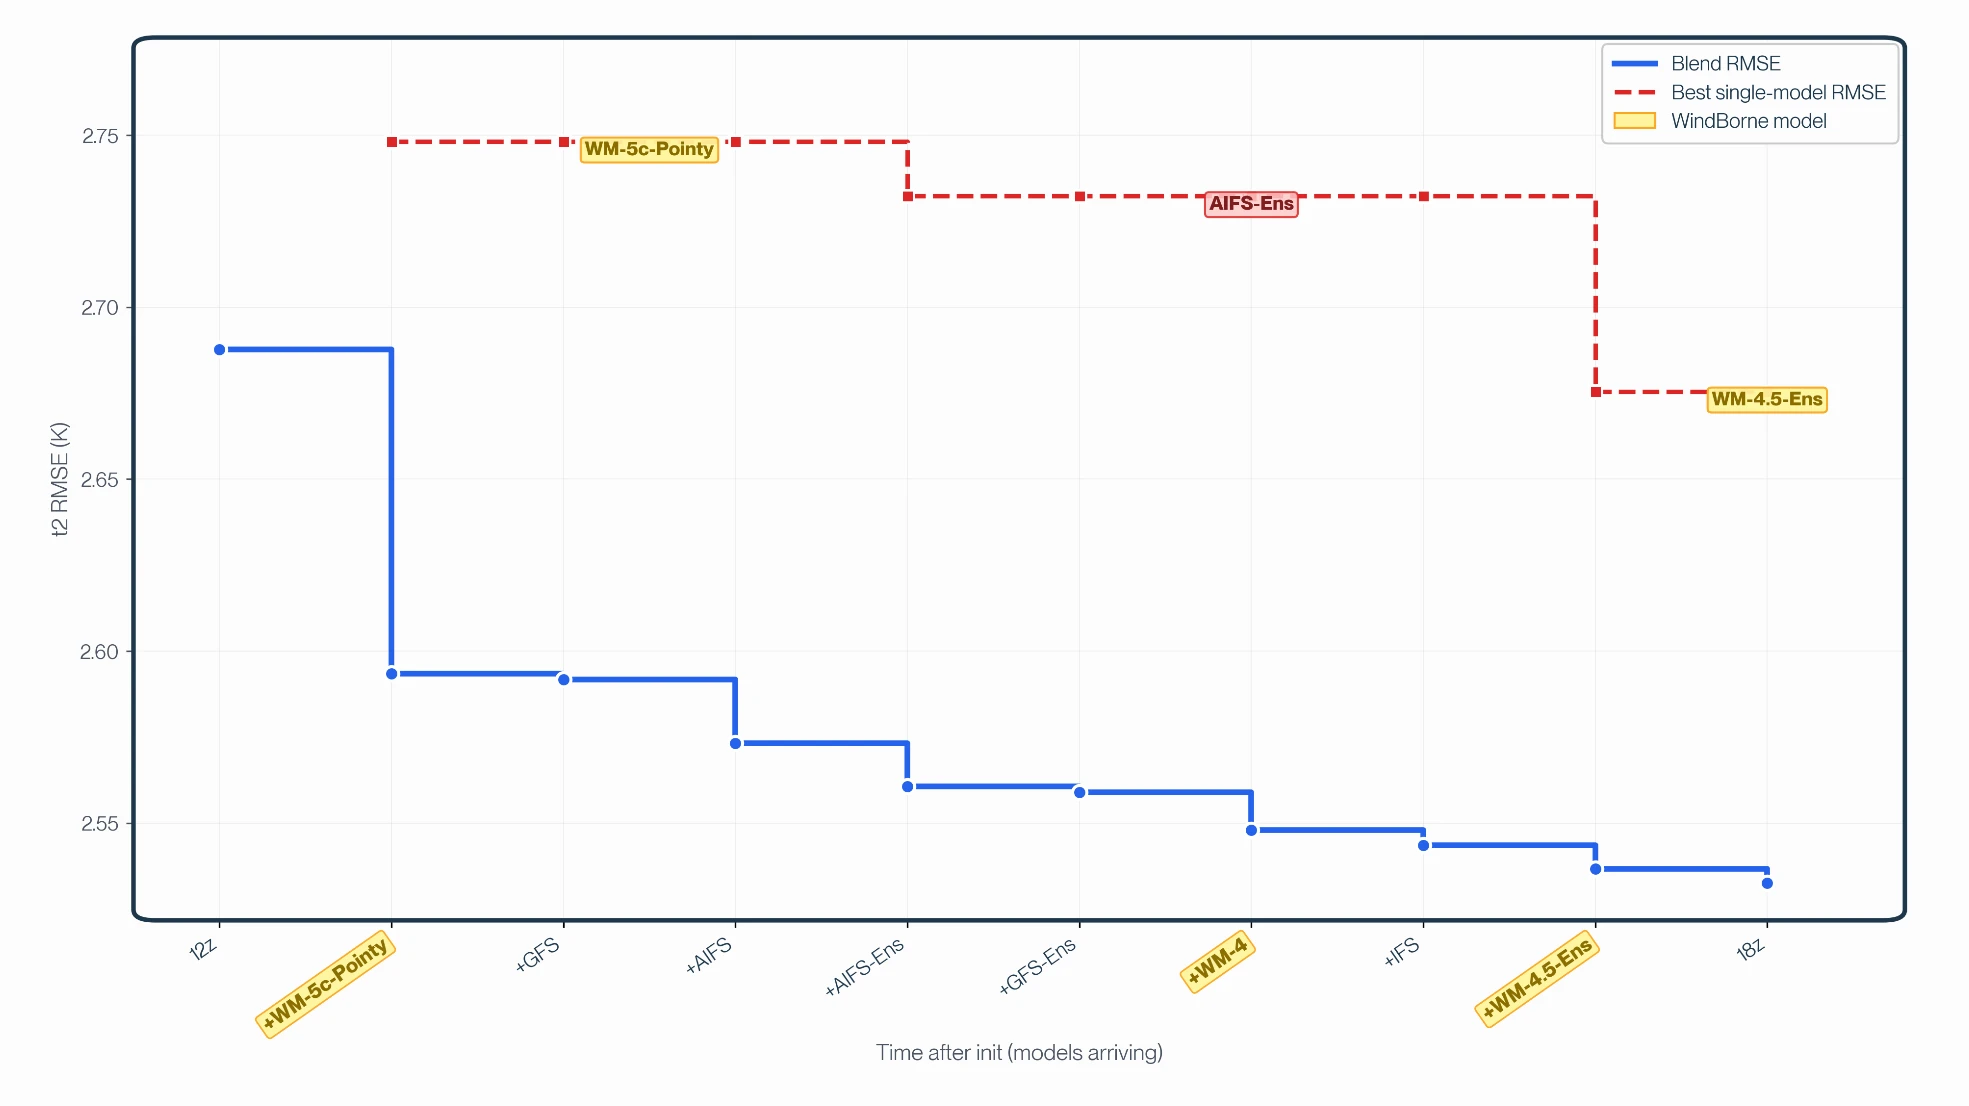
Additionally, whereas most blends apply fixed weights on a fixed schedule ("60% IFS, 40% GFS"), MetaMesh learns weights that vary by lead time, variable, and region, recalibrates them daily, and re-blends as new input models are published. The chart below captures the last part: RMSE for 2m temperature at f168 dropping as each input arrives over a forecast cycle.
7. Historical Data
Static station forecasts are archived, so past initialization times can be retrieved. Dynamic point forecasts are not archived as they are generated on demand at the user's request.